
The Pathway
- RIG
- Oct 15, 2024
- 4 min read
“The big money is not in the buying and selling, it’s in the waiting.” - Charlie Munger
The Siren Song of Compounding
Charlie Munger’s wisdom encapsulates the essence of successful investing: find a few great stocks, hold them for decades, and let the beauty of compounding work its wonders. After a long period of riding a winner, massive wealth seems assured, leaving only the pleasant dilemmas of which non-profits to endow and how to pass on the largesse to heirs.
This idyllic outcome appears even more self-evident when we reflect on our personal experiences. We often think, “I’d be so much wealthier if I had just bought Apple when the iPhone launched, or Netflix when I first subscribed, or even Microsoft when I was frantically typing my midterm essay.” Indeed, a substantial investment years ago in any of today’s great businesses would have led to remarkable wealth creation.
The Missing Piece: The Pathway

However, this retrospective view overlooks a crucial element – the Pathway. What transpired during those years before these stocks reached the promise land? Was it a smooth ascent towards inevitable greatness, or were there periods of uncertainty, doubt, or even existential threats?
The more important question is: how would you have responded when faced with adversity? Would you have calmly brushed off the volatility, confidently knowing the stock would perform exceptionally well in the decades to come? Or would you have capitulated and sought safer havens?
Deconstructing the Pathway
The purpose of the 1% IRR Project is to deconstruct investing into first principles so that they can be reconstructed for better decision-making.
In this breakdown, we deconstruct “The Pathway” - the route stock prices of some of today’s great businesses have taken to reach the mountain top.
Understanding Historical Returns
Our analysis reveals that most stocks fail to outperform the broader market, with less than 10% achieving annualized returns above 15% over a 5+ year holding period.
The chart below illustrates the 20-year annualized returns of big winners - stocks that have compounded at 15% or more annually. (This is not a comprehensive list).
20-Year Returns of Big Winners

Yellow = SPY (S&P 500 ETF)
Annualized Returns of stocks over a 20-year period
To illustrate the dramatic impact of compounded returns, the table below shows the growth of a $1,000 investment at different annual returns over a 20-year period. For a comprehensive compounding table, see here.

The Cost of Success: Depth x Length
While the long-term returns of top-performing stocks are impressive, it’s crucial to understand the volatility experienced along the way, which unfolds in two ways:
1. Max Drawdown
Most big winner stocks have experienced larger drawdowns than the S&P 500 at some point in their history. The psychological impact of losses often outweighs the pleasure of gains, which means a large drawdown could potentially lead to irrational behavior like selling at a low.
Max Drawdown over a 20-Year Period

Yellow = SPY (S&P 500 ETF)
Max Drawdown = Highest percent drop from a previous trading high. For example, if a stock traded at $100 and fell to $45, its drawdown is 55%.
2. The Challenge of Waiting
The intensity of a drawdown alone fails to convey the full challenge of the investment journey, particularly the prolonged duration of a drawdown.
% of Days Below a 50% Drawdown

Yellow = SPY (S&P 500 ETF)
The number of trading days the stock traded below 50% of a previous high. For example, if a stock traded at $100 then fell below $50 and stayed at that level for 10 years, it would trade 50% of Days Below a 50% Drawdown.
Case Study: MSFT vs S&P 500 – Compounded Returns vs. Drawdown
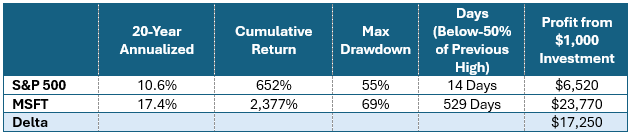
Consider Microsoft, a company that has always seemed destined for greatness. Over the past 20 years, it spent more than 10% of the time (529 trading days) trading below 50% of its previous high watermark. That’s equivalent to more than two calendar years of trading! In contrast, the S&P 500 index spent only 0.3% of the time in such a position.
Focusing on the challenging times misses the main point – MSFT compounded at 17.4% or a cumulative 2,377% over the last 20 years, while the S&P 500 compounded at 10.6% or a cumulative 652%. This is the historical proof that long-term investors should prefer a “lumpy 15% to a smooth 10%.”
The Psychological Toll
The rub of earning all that extra cash from holding a company like Microsoft is partially the volatility and partially the waiting. The effect of those 529 days shouldn’t be underestimated.
Imagine investing a significant portion of your net worth into a stock, only to see it drop by 50%. How would that feel? Now, amplify that feeling by the days, weeks, and months of mental strain.
How would you handle the scrutiny from family, friends, and colleagues questioning your decision? Is your support system truly supportive?
The point is, a drawdown isn’t typically a brief event lasting a day, a week, or even a month. As Microsoft’s history shows, there can be long periods of feeling foolish. This is a true challenge of long-term investing. The math may be elegant and inviting, but the path can be daunting. Long-term investing can be incredibly rewarding, but one must be prepared for the difficulties that lie in waiting.
Key takeaways:
Everyone can be Warren Buffett in theory, but there is only one in practice.
Investors often buy great businesses but may capitulate at the worst possible times.
Long-term investing requires understanding that rough patches are par for the course.
Recognize that these challenging periods can be both dramatic and prolonged.
Build safeguards into your investment process and mentally fortify yourself during good times to withstand challenging periods.


Comments